
The below post is notes prepared by me by studying the book "Database Systems Design, Implementation and Management" by Peter Rob and Carlos Coronel
Content, examples and diagrams are taken from that book.
Unit -5 Chapter -1 Business Intelligence and Data Warehouses.
Why there is a need for data analysis?
Or
What are DecisionSupportSystems and what role do they play in business environment.
Ans:
DecisionSupportSystem is an arrangement of computerized tools used to assist managerial decision making within a business.
Organizations tend to grow and prosper as they gain better understanding of their environment.
Data analysis can provide information about short-term tactical evaluations such as
Are our sales promotion working?
What market percentage are we controlling?
Are we attracting new customers?
Tactical and strategic decisions are also shaped by constant pressure from external and internal forces, including globalization, the cultural and legal environment and technology.
Business climate is dynamic, and thus mandates their prompt reaction to change in order to remain competitive.
Different managerial levels require different decision support needs.
For ex: TPS based on operational databases are tailored to serve the information needs of people who deal with short term inventory, accounts payable and purchasing.
Middle level managers, general managers, vice presidents and presidents focus on strategic and tactical decision making that require a DSS.
Differences between Operational and Decision Support Data characteristics
Characteristic
|
Operational Data
|
Decision Support Data
|
Data
|
Current Operations
Real- time data |
Historic Data
Snapshot of company data Time component (week/month/year) |
Granularity
|
Atomic-detailed data
|
Summarized data
|
Summarization Level
|
Low; some aggregate yields
|
High; many aggregation levels
|
Data model
|
Highly normalized
Mostly Relational DBMS |
Non-normalized
Complex structures |
Transaction type
|
Mostly updates
|
Mostly query
|
Transaction Volumes
|
High update volumes
|
Periodic loads and summary calculations
|
Transaction Speed
|
Updates are critical
|
Retrievals are critical
|
Query Activity
|
Low to medium
|
High
|
Query Scope
|
Narrow range
|
Broad range
|
Query Complexity
|
Simple to medium
|
Very complex
|
Data Volumes
|
Hundreds of megabytes upto gigabytes
|
Hundreds of gigabytes upto terabytes
|
The many differences between operational data and decision support data are good indicators of the requirements of the decision support database.
Decision Support Database Requirements
There are four main requirements for a decision support database.
- The Database Schema: must support complex (non-normalized) data representations.
- Data Extraction and Filtering: The data extraction capabilities should also support different data sources and multiple vendors. Using data from multiple external sources also usually means having to solve data formatting conflicts. Finally, to filter and integrate the operational data into decision support database.
- End- User Analytical Interface: The decision support DBMS must generate the necessary queries to retrieve the appropriate data from decision support database.
- Database Size: To support very large databases (VLDBs), the DBMS might be required to use advanced hardware, such as multiple disk arrays, multiple-processor technologies such as symmetric multiprocessor(SMP) or a massively parallel processor (MPP).
What is data warehouse? Discuss about the properties of a data warehouse?
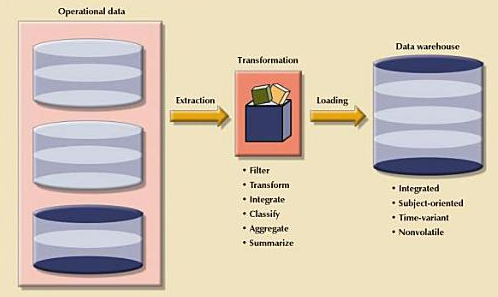
Ans: Data warehouse is an integrated, subject oriented, time variant, non volatile collection of data that provides support for decision making.
The following are important properties of a data warehouse.
Integrated:
The data warehouse is a centralized, consolidated database that integrates data derived from the entire organization and from multiple sources with diverse formats.
Data integration implies that all business entities, data elements, data characteristics and business metrics are described in the same way throughout the enterprise.
Subject oriented:
Data warehouse data are arranged and optimized to provide answer to questions coming from diverse functional areas within a company.
Data warehouse data are organized and summarized by topic. .
Instead of storing a INVOICE table, data warehouse stores its “sales by product” and “sales by customer” components.
Time variant:
Warehouse data represent the flow of data through time.
Once data are periodically uploaded to the data warehouse, all time dependent aggregations are recomputed.
Non Volatile:
Once data enter the data warehouse, they are never removed. Because data are never deleted and new data are continually added the data warehouse is always growing.
The ETL process in the creation of data warehouse
What is Business Intelligence?
Business Intelligence is a framework that allows a business to transform data into information, information into knowledge and knowledge into wisdom.
The following are the BI architectural components.
- Data extraction, transformation and loading (ETL) tools : this component is in charge of collecting, filtering, integrating and aggregating operational data to be saved into a data store.
- Data Store: the data store is optimized for decision support and generally represented by a data warehouse or a data mart.
- Data Query and Analysis Tools: this component performs data retrieval, data analysis and data mining tasks using the data in the data store represented in the form of an OLAP tool.
- Data presentation and visualization tools: this component is in charge of presenting the data to the end user.
What are datamarts?
Ans: A data mart is a small, single - subject data warehouse subset that provides decision support to a small group of people. Instead of creating a data warehouse for entire organization, manageable data sets that are targeted to meet the special needs of small groups within the organization are created. These smaller data store are called data marts.
What is OLAP? What are the four main characteristics of OLAP systems?
Ans: Online analytical processing create an advanced data analysis environment that supports decision making, business modeling and operation research.
OLAP systems share four main characteristics:
- They use multidimensional data analysis techniques.
- They provide advanced data anlysis support.
- They provide easy - to - use end user interface.
- They support client/server architecture.
Multidimensional Data Analysis Techniques: In multi dimensional analysis, data are processed and viewed as part of a multidimensional structure. This is useful in business decision making because decision makers tend to view business data as data that are related to other business data.
These techniques are augmented by the following functions:
- Advanced data presentation functions such as 3- D graphics, 3-D cubes etc. Such facilities are compatible with desktop spreadsheets etc.
- Advanced data aggregation, consolidation and classification functions: create multiple data aggregation levels, slice and dice data and drill down and roll up data across different dimensions and aggregation levels
- Advanced computational functions: These include business oriented variables (market share, sales margins etc..) and financial accounting ratios and statistical and forecasting functions. These functions are provided automatically.
- Advanced data modeling functions like linear programming and other modeling tools
Advanced database support.
OLAP tools must have advanced data access features such as
- Access to many different kinds of DBMSs
- Access to aggregated data warehouse data as well as detail data found in operational databases
- Advanced data navigation features such as drill down and roll up.
- Rapid and consistent query response times.
Easy to use end user interface:OLAP features become more useful when access to them is kept simple. OLAP tool vendors have included easy-to-use graphical interfaces.
Explain about OLAP architecture?
OLAP operational characteristics can be divided into 3 main modules.
- Graphical User Interface (GUI)
- Analytical Processing Logic
- Data Processing Logic
OLAP System
The OLAP System exhibits..
* Client/Server Architecture
*Easy-to-use GUI
Dimensional Presentation
Dimensional Modeling
Dimensional analysis
* Multidimensional Data
Analysis
Manipulation
Structure
*Database Support
Datawarehouse
* Dimensional Operational database
* Aggregated Relational
* Very Large Database Multi dimensional
Above figure illustrates that OLAP systems are designed to use both operational and data warehouse data.
Above figure shows that the OLAP system components are located on a single computer. One problem with installation shown above is that each data analyst must have a powerful computer to store the OLAP system and perform all data processing locally. Each analyst uses a separate copy of the data. Therefore, the data copies must be synchronized to ensure that analysts are working with same data.
OLAP Server arrangement: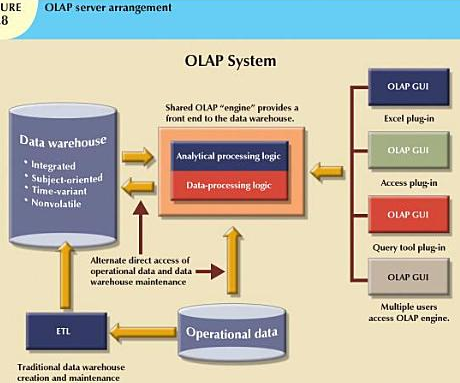
Here OLAP gui runs on client workstation while OLAP engine or server runs on a shared computer and this forms a middle layer. The OLAP server will accept and processes the data processing requests generated by the many
end user analytical tools. The end- user GUI may be a plug-in module integrated with Excel, Lotus 1-2-3etc..
Why data warehouse when OLAP provides the necessary multi dimensional data analysis of operational data?
Ans: Because the data warehouse handles the data component more efficiently than OLAP does.
What is ROLAP?
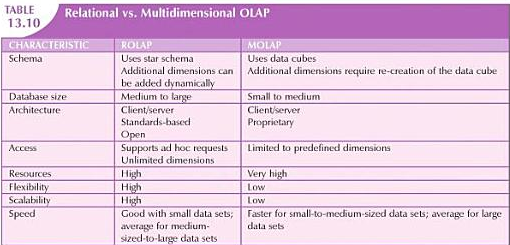
Relational online analytical processing provides OLAP functionality by using relational databases and familiar relational query tools to store and analyze multi dimensional data.
ROLAP adds the following extentions to traditional RDBMS technology.
- Multi dimensional data Schema support within the RDBMS : uses Star Schema
- Data access language and query performance optimized for multi dimensional data.
Uses bitmapped indexes as they are efficient at handling large amounts of data than the indexes used in RDBMS. Bitmapped indexes are primarily used in situations where the number of possible values for an attribute is fairly small.
- Support for very large databases (VLDBs)
What is MOLAP?
Multi dimensional online analytical processing provides OLAP functionality to Multidimensional database management.
MDBMS uses special proprietary techniques to store data in matrix-like n-dimensional arrays.
MDBMS end users visualize the stored data as a 3-D cube known as data cube
The location of each data value in the data cube is a function of the x-,y-,z-axes in a 3D space.
The x-,y-,z-axes represent the dimensions of the data value.
Hypercube is a data cube grown to n- dimensions
Because the data cube is predefined with a predefined number of dimensions, the addition of a new dimension requires that the entire data cube be recreated and this process is time consuming.
Differences between ROLAP and MOLAP
Multi dimensional data analysis requires some type of multidimensional data representation, which is normally provided by the OLAP engine.
Whatever the arrangement of the OLAP components, multi dimensional data must be used.
Discuss about Star Schema Architecture?
Ans:The star schema is a data modeling technique used to map multidimensional decision support data into relational database.
The basic star schema has four components: facts, dimensions, attributes and attribute hierarchies
Facts: Facts are numeric measurements that represent a specific business aspect or activity. Ex: units, costs, prices.
Facts are normally stored in a fact table that is center of the star schema. The fact table contains facts that are linked through their dimensions.
Facts computed or derived at run time are called metrics
Dimensions: provide descriptive qualifying characteristics about the facts through their attributes.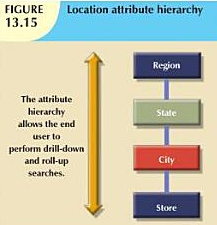
For ex: sales might be compared by product from region to region and from one time period to the next.
Dimensions are stored in dimension tables. The figure shows star schema for sales with product, location and time dimensions.
Attributes: Each dimension table contains attributes. Attributes are often used to search, filter or classify facts.
Possible attributes for Location dimension are Region, State, City, Store etc...
Possible attributes for Product dimension are Product Type, Product ID, brand, package, presentation, color, size and Possible attributes for Time dimension are Year, Quarter, Month, Week , Day, Time of day and so on
Attribute hierarchies: Attributes with in dimensions can be ordered in a well defined attribute hierarchy. The attribute hierarchy provide a top- down data organization that is used for two main purposes : aggregation and drill down/roll-up data analysis.
Star Schema Representation
Ans: The fact table is related to each dimension table in a (M:1) relationship
i.e, many fact rows are related to each dimension row
and so the primary key of the fact table is composite primary key.
As per the figure, each sales record represents each product sold to a specific customer, at a specific time and in a specific location
DBMS that is optimized for decision support first searches the smaller dimension tables before accessing
the larger fact tables.
Performance improving techniques for the star schema
Ans: Four techniques are often used to optimize data warehouse design:
Normalizing dimensional tables: the resulting schema with normalized dimension tables is called snowflakes schema.
Maintaining multiple fact tables to represent different aggregation levels.
Denormalizing fact tables.
Partitioning and replicating tables.

What is data mining? Explain its various phases.
Ans: Data mining tool automatically search the data for anomalies and possible relationships, thereby identifying problems that have not yet been identified by the end user.
Data mining is very helpful in finding practical relationships among data that help define customer buying patterns, improve product development and acceptance, reduce health care fraud, analyze stock markets etc..
Data mining is subject to four general phases:
Data preparation phase : data sets to be used by the data mining operation are identified and cleansed.
Data analysis and classification phase: identifies common data characteristics or patterns.
The data mining tool applies specific algorithms to find
Data groupings, classifications, clusters or sequences
Data dependencies, links or relationships
Data patterns, trends and deviations
Knowledge Acquisition phase: selects the appropriate modeling or knowledge acquisition algorithms to generate a computer model that reflects the behavior of the target data set.
Prognosis phase: In this phase, the data mining findings are used to predict future behavior and forecast business outcomes.
To project the likely outcome of new product rollout or a new marketing promotion.
What are indictive or intelligent databases?
Ans: The databases that not only store data and various statistics about data usage, but also have the ability to learn about and extract knowledge from the stored data.
Explain about SQL extensions for OLAP?
Ans: The following are important SQL extensions for OLAP
The ROLLUP extension: is used with the GROUP BY clause to generate aggregates by different dimensions.
Syntax:
SELECT column1, column2 [,…],aggregate_function(expression)
FROM table1, [table2,…]
[WHERE condition]
GROUP BY ROLL UP(column1,column2[,…])
[HAVING condition]
[ORDER BY column1[,column2,…]]
The order of the column list within the GROUP BY ROLL UP is very important. The last column in the list will generate a grand total. All other columns will generate subtotals.
The CUBE extension:
Is used to compute all possible subtotals within groupings based on multiple dimensions.
The CUBE extension will enable to get a subtotal for each column listed in the expression and grand total for the last column listed.
Syntax: SELECT column1, column2 [,…],aggregate_function(expression)
FROM table1, [table2,…]
[WHERE condition]
GROUP BY CUBE(column1,column2[,…])
[HAVING condition]
[ORDER BY column1[,column2,…]]
Materialized views:
A materialized view is a dynamic table that not only contains the SQL query command to generate the rows, but also stores the actual rows. The materialized view created the first time the query is run and summary rows are stored in the table. The materialized view row are automatically updated when the base tables are updated.
Syntax:
CREATE MATERIALIZED VIEW view_name
BUILD { IMMEDIATE | DEFERRED}
REFRESH {[FAST | COMPLETE | FORCE]} ON COMMIT
[ENABLE QUERY REWRITE]
AS select_query
The BUILD clause indicate when the materialized view rows are actually populated.
IMMEDIATE indicates rows are populated right after the command is entered.
DEFFERED indicates rows are populated at a later time. Until then view will be in an unusable state.
The REFRESH clause lets you indicate when and how to update the view when new rows are added to base tables.
FAST indicates updates only affected rows.
COMPLETE indicates a complete update will be made for all rows in materialized view.
FORCE indicates that the DBMS will first try to do a FAST update, otherwise it will do a COMPLETE update.
ON COMMIT indicates the updates to the materialized view will take place as a part of the commit of the DML transaction that updated the base tables.
ENABLE QUERY REWRITE option allow DBMS to use the materialized views in query optimization.
No comments:
Post a Comment